The Ubinas volcano hazard map: advances in disseminating geoscience information in Peru
Introduction
The Ubinas Volcano began its current phase of eruptive activity in March 2006. Shortly after the eruption began, Peru’s Geological, Mining and Metallurgical Institute (INGEMMET) decided to map the existing hazards at the Ubinas Volcano. These maps could be used as a resource for crisis management. Geologists/volcanologists from the following institutions participated in developing the map: INGEMMET, the Blaise Pascal University (UBP) of France, the Development Research Institute (IRD) of France, the National Autonomous University of Mexico (UNAM), and the Multinational Andean Project: Geoscience for Andean Communities (MAP:GAC). The following organizations were also involved: the Moquegua and Arequipa offices of the National Civil Defense Institute, the Center for Disaster Studies and Prevention (PREDES), and the National Meteorological and Hydrological Service (SENAMHI). As it tends to happen in times of volcanic crisis, the map was prepared very quickly, making it impossible to get suggestions on its design from the authorities or from the people who were affected. |
A volcanic hazard map is cartographic information that shows the areas that could be affected by one or more potentially destructive volcanic processes. The areas are divided according to the different levels of hazard, which are determined by the frequency and type of events that have affected these areas in the past, their magnitude and the geomorphological characteristics of the region. In addition, a hazard map enables people to learn about the physical setting where risk-generating natural phenomena occur; thereby enabling them to be better prepared to cope with the hazards to which they are exposed. This type of map can also be utilized in land-use and development planning, and in prevention education strategies. However, it is important to bear in mind that most hazard maps are unfamiliar to the public and are not used for their original purpose. This happens, in part, because the institutions that produce this information have shown little interest in appropriately and opportunely distributing the maps and explaining them to the population.
The Ubinas volcano hazard map
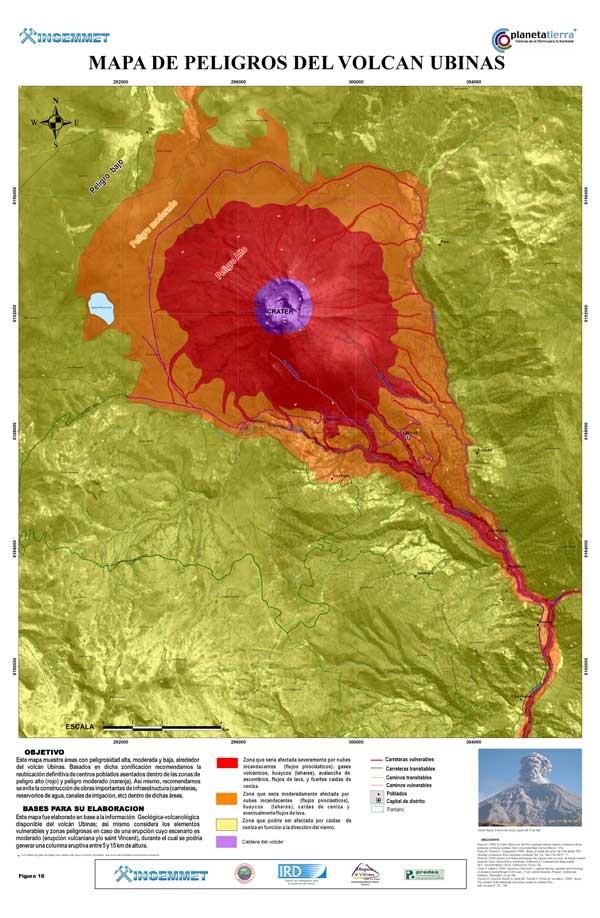
The Ubinas Volcano hazard map (Figure 1) was developed by drawing on information about the volcano’s history of activity during the last 500 years, which has been characterized by low to moderate magnitude eruptions, ranging from 1 to 4 on the Volcanic Explosivity Index (VEI). The definition of hazard zones was based on the following: geological/volcanological studies, the frequency of eruptions, the areas affected in past eruptions, the current chemical composition of the magma, and the morphological characteristics of the area surrounding the volcano. The map is divided into three zones, according to the severity of the hazard: a) the high-hazard zone, which could be severely affected by several inches of ash, pumice and scoria; pyroclastic flows, lahars, debris avalanches, lava flows, and possibly volcanic gases; b) the medium-hazard zone, which could be affected by pyroclastic flows, lahars, debris avalanches, and by moderate ash, pumice lapilli and scoria falls; c) the low-hazard zone, which basically can be affected by ash, pumice lapilli and scoria falls, whose dispersion depends on the direction of the wind, which is quite variable.
Disseminating the hazard map
Contrary to what many geoscientists still think, hazard maps are prepared for the authorities and for the public, including people who generally do not have geoscientific training. For this reason, the Ubinas Volcano hazard map uses lay language and a simple design, to ensure that it can be easily understood by local residents and by the people in charge of managing a volcanic crisis. In 2006, the contents and meaning of the hazard map were explained during a number of working meetings with government officials from the Moquegua region and the Ubinas municipal district, with teachers and students, and with people who live in the Ubinas Valley (Figure 2). Although the population in the affected area is small (around 3,500 inhabitants), the hazard map was not completely disseminated in 2006 and only a small percentage of local residents saw it.
However, with laudable effort and vision, several institutions, including Caritas Moquegua, Oxfam America, the Moquegua regional government, the Ubinas municipal district and INGEMMET, worked on the mass dissemination of the Ubinas Volcano hazard map in 2007, in all the locations affected by its eruption. This process was carried out as part of the project titled “Llusp´Iy: Living with Risk, the Ubinas Volcano Eruption.” As part of this effort, several hundred copies of the map were printed at approximate scales of 1/15,000 and 1/50,000. The map is now being displayed in strategic public locations in the area affected by the eruption (Figures 3 and 4), such as the municipal offices, community centers, schools, health clinics, restaurants and stores in Ubinas, Querapi, Anascapa, Sacoaya, Tonohaya, San Miguel, Huarina and Sacoaya, among other locations. Disseminating the map is very important because it will enable local residents to easily find information and learn more about their own environment.
Use of the hazard map
During the first stages of the current period of activity, the Ubinas Volcano hazard map was used by the people in charge of managing the volcanic crisis to develop contingency plans, map evacuation routes and set up shelters (Figures 5 and 6). These shelters are located in low-hazard areas (in yellow on the map) in Anascapa and Chacchagén. The residents of Querapi were evacuated to Anascapa on April 20, 2006, where they remained for over eight months. The people from Ubinas, Escacha, Tonohaya, San Miguel and Huarina were evacuated on June 9-11, 2006 to Chacchagén, where they spent nearly six months (Figure 7).
By issuing official notice No. 085-2006-P/RDC.MOQ, the Moquegua regional government requested that INGEMMET develop a technical report to support the permanent relocation of several communities repeatedly affected by the volcano’s activity. In September 2006, INGEMMET submitted a technical report titled “Assessment of physical safety in influence areas of the Ubinas Volcano.”
The report included an assessment of the hazards posed by the Ubinas Volcano and used the hazard map to recommend changing land-use patterns in the Ubinas Valley as a mid- and long-term risk prevention and mitigation measure. To this end, the report recommended permanently relocating those communities living in the high- and medium-hazard areas (in red and orange on the hazard map), which include the communities of Querapi, Ubinas, Huatahua, Tonohaya, San Miguel and Sacoaya. It also recommended that large public works projects (water supply systems, reservoirs, roads, etc.) should not be built or developed inside high- and medium-hazard areas, and it called on the corresponding agencies to declare the Ubinas Volcano and its surroundings a conservation area or a protected nature reserve. In the past year, the Moquegua regional government has made progress regarding the relocation process. In addition, it has conducted a census of the people affected, and has been building a waterway to Hawaii (the relocation site), and it is developing a comprehensive project that takes into account people’s social and economic adjustment to their new home. If nothing happens to stall or stop this work, the relocation process should be completed in four years.
At present, the Moquegua Regional Civil Defense Committee and the Ubinas District Civil Defense Committee are implementing prevention education activities, posting signs along evacuation routes and holding drills. Knowledge and understanding of the hazard map are an important component of all these activities.
New challenges for bringing volcano hazard maps to a wider audience in southern Peru
Recently, INGEMMET completed a hazard map for the Misti Volcano and will shortly be distributing 1,000 copies in the city of Arequipa. However, reaching people with this map will take a greater effort than in Ubinas, for two primary reasons: first, the metropolitan Arequipa population is around 830,000 people, far more than the 3,500 residents of the Ubinas Valley; and second, because the Misti Volcano is not currently erupting and therefore Arequipa’s residents and authorities are not paying that much attention to it. INGEMMET needs to design an appropriate, efficient way to disseminate the Misti Volcano hazard map and get it into people’s hands. In order to meet this goal, INGEMMET is carrying out the following activities: a) coordination with both the regional government and the provincial municipal government of Arequipa, for these entities to issue ordinances that make the map official and to recommend its use in development and land-use planning in Arequipa; b) coordination with the education authorities of the Arequipa regional government to include the hazard map in the primary and secondary school curricula. A training program for school teachers must be developed for this purpose; and c) print more copies of the map, with support from private companies, local institutions and NGOs. |
Source:
Jersy Mariño Salazar
Geologist/Volcanologist
Geological, Mining and Metallurgical Institute, Peru
Av. Canadá 1470, San Borja, Lima, Peru
jmarino@ingemmet.gob.pe
+51-1-6189800
|